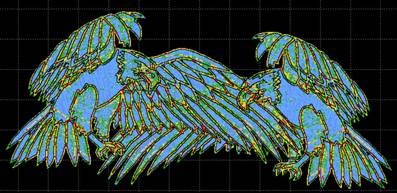
The
Density Map is a graphical display of the density, or stitches-per-inch in your
designs. To see the Density Map, click the button on the main toolbar. This is
useful to see if a design is not going to sew well. For instance, this is a
design that has been overlapped, thus its density is very high.
Like weather radar,
the density map shows areas where trouble is likely:
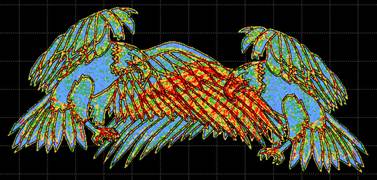
Where the design shows bright red in color, there are
six layers or more of thread, which undoubtedly will produce poor embroidery
results.
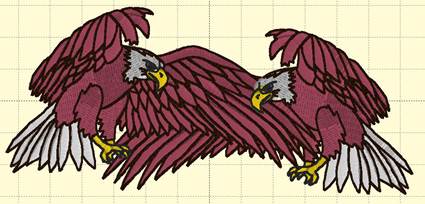
The Density Map can be used to illustrate when a design
(probably from the internet) is dangerous to sew on a project without test
sewing it first. And it also helps identify when you would want to you’re the
Remove Hidden Stitches function or even the Sweep. Those features will remove
stitches that are likely to cause poor design production, while maintaining the
same visual design. Here is the same design after a Sweep is performed: