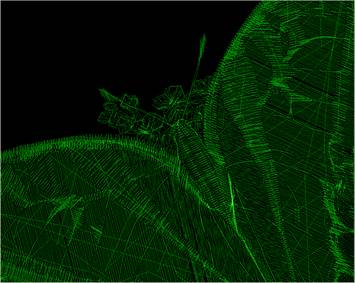
The WireLine Density Map is like a x-ray of your design, allowing you to see through the layers of stitching to analyze those under- neath. It helps to see the relationship of padding stitches, as well as how a design has been compensated. You can view the whole design or individual colors to better see what’s going on inside your design. Zooming in the WireLine allows you to get up-close and personal with the stitches to see how they were digitized. When determining which colors to remove hidden stitches from, the Wire- Line Density map is your best analysis tool. And, in addition to all the above, it looks really cool.